

Current State of the Markets
With the recent market pullback making headlines, we wanted to take a moment to address any concerns or doubts you may have. Market pullbacks are a natural part of the business cycle, and while they may feel unsettling, they are necessary for long-term market health. A market that grows too quickly without cooling off can lead to bubbles, like we saw back in 2000. While no one enjoys seeing the market sell off, it is a sign of a balanced and healthy system. The ability to remain calm and stay invested during turbulent times is key to long-term success. This ability separates the average investor from a good one.
When the market begins to sell off, it is key to take a step back and put things into perspective. Let’s look at how the S&P 500 has performed over the past few years:
- The S&P 500 total return from the start of 2021 (January 4, 2021) is 50.57%1, which includes the recent pullback.
- Narrowing the scope, the S&P 500 is only down 5.05%2 year-to-date (as of March 11, 2025).
 S&P 500 Level 1/4/2021 - 03/11/2025
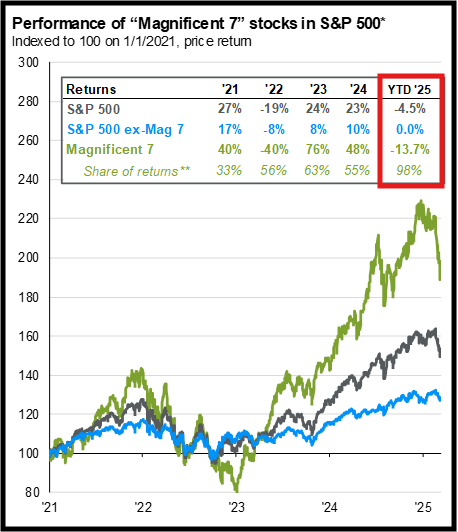
The strong rally in U.S. equities since COVID, especially over the past two years, has led to stretched valuations and a high level of market concentration within the top 10 companies (35.4% as of March 10, 2025)3. Frankly, the market was due for a breather but there is a silver lining: the top 10 names have sold off disproportionately to the rest of the S&P 500. While this still results in the index declining, it would be more concerning if the other, more reasonably valued, 490 stocks, were selling off at the same magnitude. To us, this seems more of a correction of the big names with lofty valuations vs. the market as a whole.
Now, you might be wondering, "What if the U.S. falls into a recession?" It's a fair question – the R word gets thrown around a lot at the first sign of weakness. There’s always an element of risk, but we can gauge the economy’s health by looking at the underlying fundamentals. Let’s start with the big data points -- inflation, unemployment, and corporate earnings:
- Inflation is hovering between the high 2% to low 3% range—not quite pre-COVID levels, but not a red flag either.
- Unemployment has held steady at 4.0%-4.1% for a few quarters now, well below the 50-year average of 6.1%.
- S&P 500 companies have continued to deliver stellar earnings, with 99% having reported Q4 results and just over 76%4 beating analyst expectations. This led to about 18.00%5 year-over-year earnings growth.
So yes, the market has pulled back recently, but the data suggests this is more about headline-driven uncertainty (tariffs) than material economic weakness.
Risks
As much as we would love to have a crystal ball, the reality is we don’t. There will always be risks in the market, both seen and unseen, which could drive equities lower. One potential crack in the economy is the health of the US consumer. Wage growth has moderated back to historical levels in addition to credit card and auto loan delinquencies reaching levels higher than their pre-COVID range. This suggests a weakening US consumer. Despite this, the US consumer has repeatedly shown their resilience and propensity to spend. Personal consumption is 5.6%6 higher y/y January 2024 through January 2025. While consumer sentiment has declined, it is important to remember that perception does not always align with economic reality. Prolonged negative sentiment could lead to a slowdown despite otherwise solid data – a self-fulfilling prophecy.
Political uncertainty is inherent within financial markets and contributes to volatility — more so as of late. President Trump’s approach to policy and communication has introduced heightened headline risk, but this was largely expected. His focus on tariffs has raised future growth concerns, as tariffs tend to increase costs for both businesses and consumers. The 25% tariffs on our neighbors to the north and south make up roughly 27% of total U.S. imports and could put further pressure on consumers. While tariffs can serve a purpose, the reality is that increased trade friction can be a drag on economic output.
Tactical Positioning
Small Caps
With the macroeconomic outlook covered, let’s now shift focus to how we are tactically adjusting your portfolio to navigate the current market environment.
Back in mid-December 2024, we strategically added domestic small-cap equities to the portfolio. These companies, with market caps ranging from $250 million to $2 billion, offer significant potential due to several favorable tailwinds.
First, there is a notable valuation disparity between small-cap and large-cap stocks, which is currently the widest it's been since 2000. In simpler terms, small caps are at their most undervalued point in 25 years relative to large caps. We've seen the market on the hunt for more reasonable valuations outside of US large-cap names, particularly in international markets. Should this trend persist, the logical next step would be for capital to begin flowing into small caps, due to their attractive valuation relative to their large cap peers.
Second, the current administration’s business friendly policies should be a tailwind for the smaller companies. Deregulation is expected to remove some of the hurdles that smaller businesses must jump over, fostering innovation and increasing competition with larger firms. Unlike big corporations with deep pockets and extensive resources, smaller companies often struggle with compliance costs and bureaucratic red tape. Reducing these barriers should help to level the playing field. While tariffs typically weigh on growth, their impact tends to hit global corporations harder than smaller companies. With a significant portion of small-cap revenue generated domestically, these companies are more insulated against higher costs caused by tariffs.
One more point on small US companies: it appears that small-cap earnings have already gone through their correction phase. Recent data suggests that earnings have bottomed out and are beginning to trend upward, a positive signal for the asset class.

Maintaining Risk Levels
While we have added a more volatile asset class to the portfolio, we have also incorporated a few hedges to manage the overall risk level. Should markets deteriorate further from current levels, the portfolio is structured to reduce volatility and maintain some dry powder, allowing us to deploy capital at more attractive entry points.
Wrap Up
While the recent market swings may feel unsettling, we remain active in pursuit of attractive tradeoffs between risk and return. For our clients who seek to add capital or increase risk on downswings, moves like this present an opportunity. For our more conservative clients, the focus is mitigating the downside risk.
Across all clients, a key priority for us is maintaining our ability to maneuver for you. We are running a portfolio that is diversified across geography, currency, sector, and asset class. We are currently in a strong position to capture a potential market rebound, while retaining plenty of portfolio maneuverability if we see further declines. As a final reminder, market pullbacks are a normal and healthy part of investing. We remain invested for the long term, and most importantly, we remain optimistic on the future of financial markets.
Sources:
- FactSet: S&P 500 Level 1/4/2021-3/11/2025
- FactSet: S&P 500 Level 1/2/2025-3/11/2025
Source: FactSet, Standard & Poor’s, J.P. Morgan Asset Management. The top 10 S&P 500 companies are based on the 10 largest index constituents at the beginning of each quarter.As of 2/28/2025, the top 10 companies in the index were AAPL (7.2%), NVDA (6.1%), MSFT (5.9%), AMZN (3.9%), GOOGL/GOOG (3.6%), META (2.9%), BRK.B (1.9%), AVGO (1.8%), TSLA (1.6%), and JPM (1.5%).The remaining stocks represent the rest of the 492 companies in the S&P 500.
Guide to the Markets – U.S. Data are as of March 10, 2025.- FactSet: S&P 500 2024 Q4 Earnings Scorecard: % of companies that beat earnings estimates
- FactSet: S&P 500 Earnings Scorecard: Net income growth Q42024/Q42023
- U.S. Bureau of Economic Analysis
- Small Business Earnings Chart: https://www.nfib.com/wp-content/uploads/2025/01/NFIB-SBET-Report-Dec.-2024.pdf